
I’m going to be doing an analysis on the Gapminder dataset. I’ll be looking at the relationship between the internet usage rate and the life expectancy variables, as well as the association between internet usage and employment rates.
Here’s the code used to produce the visualizations and run the Pearson correlation on the chosen variables in the Gapminder dataset.
import statsmodels.formula.api as smf
import statsmodels.stats.multicomp as multi
from scipy.stats import pearsonr
import pandas as pd
from seaborn import regplot
import matplotlib.pyplot as plt
# check for missing data
def check_missing(dataframe, cols):
for col in cols:
print("Column {} is missing:".format(col))
print((dataframe[col].values == ' ').sum())
print()
# convert to numeric
def to_numeric(dataframe, cols):
for col in cols:
dataframe[col] = dataframe[col].convert_objects(convert_numeric=True)
# check frequency distribution
def freq_dist(dataframe, cols, norm_cols):
for col in cols:
print("Fred dist for: {}".format(col))
count = dataframe[col].value_counts(sort=False, dropna=False)
print(count)
for col in norm_cols:
print("Fred dist for: {}".format(col))
count = dataframe[col].value_counts(sort=False, dropna=False, normalize=True)
print(count)
df = pd.read_csv("gapminder.csv")
#print(dataframe.head())
#print(df.isnull().values.any())
cols = ['lifeexpectancy', 'breastcancerper100th', 'suicideper100th']
norm_cols = ['internetuserate', 'employrate']
df2 = df.copy()
#check_missing(df, cols)
#check_missing(df, norm_cols)
to_numeric(df2, cols)
to_numeric(df2, norm_cols)
#freq_dist(df2, cols, norm_cols)
df_clean = df2.dropna()
def plot_regression(x, y, data, label_1, label_2):
reg_plot = regplot(x=x, y=y, fit_reg=True, data=data)
plt.xlabel(label_1)
plt.ylabel(label_2)
plt.show()
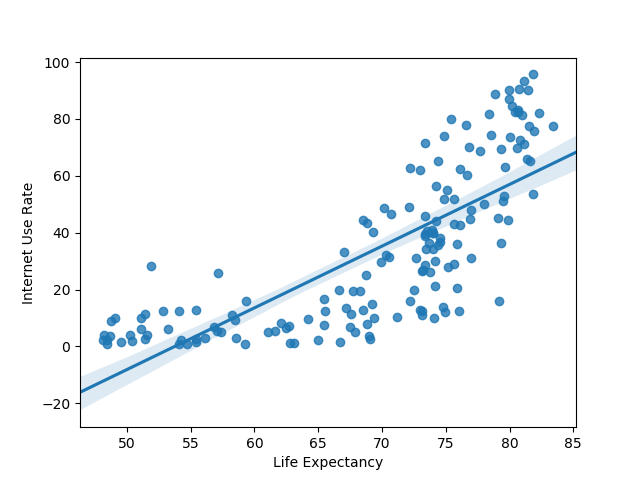
plot_regression('lifeexpectancy', 'internetuserate', df_clean, 'Life Expectancy', 'Internet Use Rate')
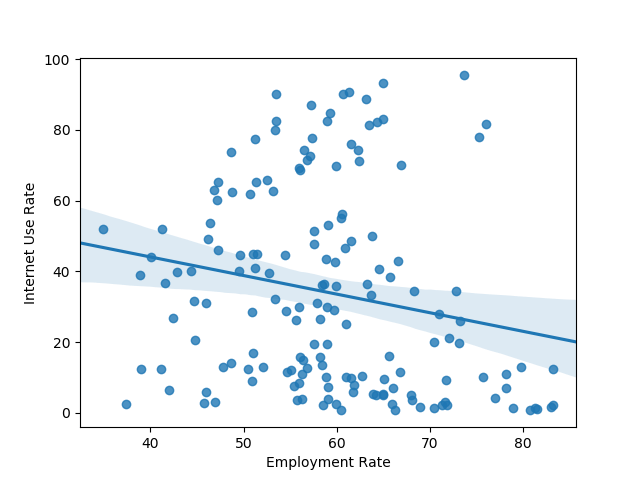
plot_regression('lifeexpectancy', 'employrate', df_clean, 'Life Expectancy', 'Employment Rate')
print('Association between life expectancy and internet use rate')
print(pearsonr(df_clean['lifeexpectancy'], df_clean['internetuserate']))
print('Association between employment rate and internet use rate')
print(pearsonr(df_clean['employrate'], df_clean['internetuserate']))
Here’s the plots that were rendered:
Here’s the output of the Pearson correlation:
Association between life expectancy and internet use rate
(0.77081050888289, 5.983388253650836e-33)
—
Association between employment rate and internet use rate
(-0.1950109538173115, 0.013175901971555317)
Based on the information above, it looks like life expectancy and internet use rate have a very strong correlation that is highly unlikely to be of chance. Meanwhile, employment rate and internet use see a less robust, though significant correlation. There’s a weak negative correlation for the second two variables.
